Favorites are the frequently used dashboard that you save in your profile for quick loading and avoid the effort of recreating it all over again. In the current context, favorites comprise a group of charts from different metrics. For example, if you are monitoring Metrics – A and B, and you want to visualize the CPU utilization in the form of a graph for the first metrics and the CPU Percentage breakdown in the form of a table for the other Metrics, you can add the charts – graphs and tables from specific metrics to the Favorites for faster visualization of performance data. Performance of all business critical servers and applications metrics can be viewed in a single place using the Favorites feature.
Favorite allows you to add and save current views of graphs to view in the future in favorites. When you load a saved favorite, then all graphs of favorites are displayed on the graph panel of Favorite and you can do widget Operation as well. When you launch the Dashboard it opens favorite in the following order:
- Based on user default
- Based on system default if user default is not there
Note: Favorite has various types of layouts. One layout is a combination of various types of widgets of different sizes. There are predefined Layouts Templates bundled with the product. You can create a new custom layout and can save the same. Canvas, a design mode of Favorite, using which you can Create, Update and Modify/Delete the Favorite.
Adding a Dashboard Favorite
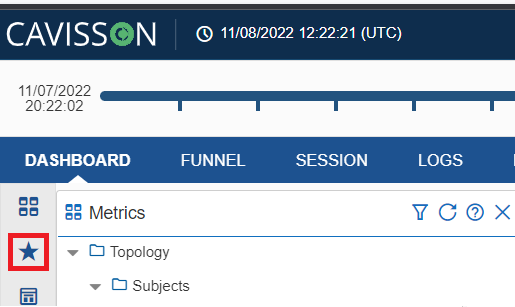
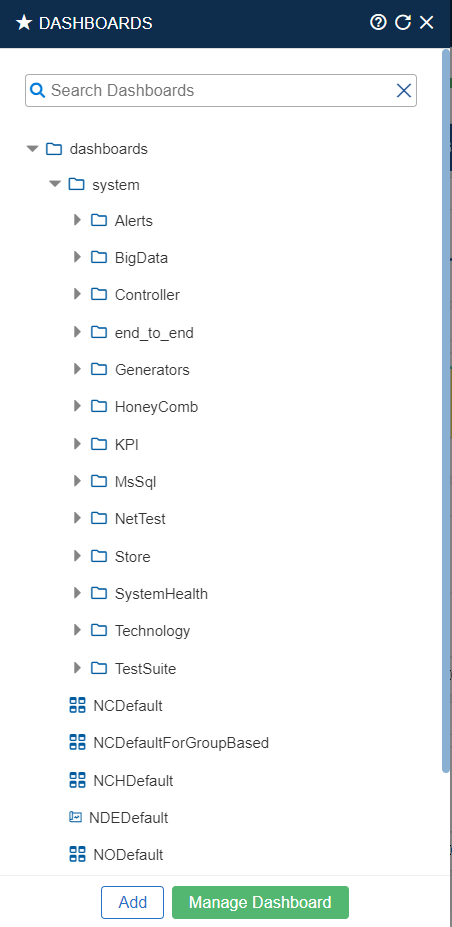
- On the left panel, click the Dashboard Favorites menu
 as shown in below figure.
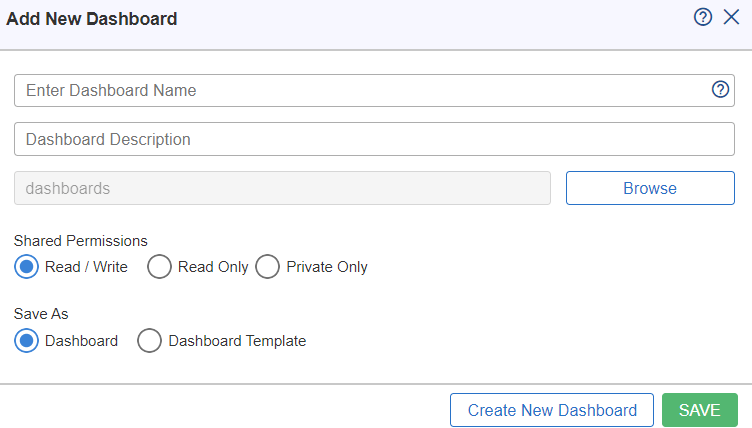
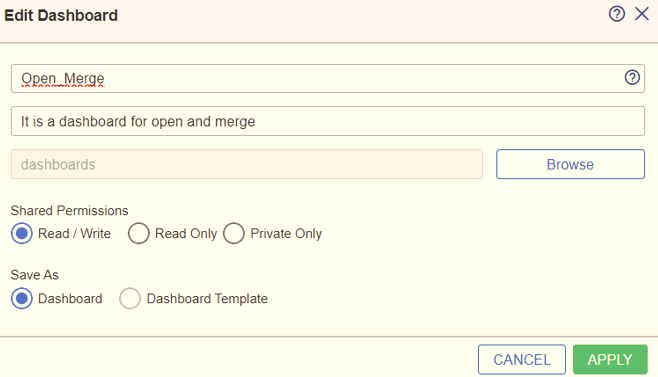
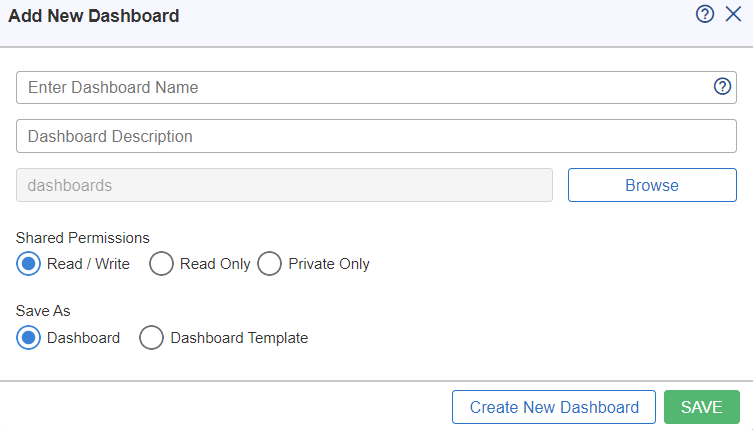
5. Enter the Dashboard name and the description.Follow the below mentioned conditions:
- Maximum character length of Dashboard name should be 64 letters.
- Name of the Dashboard should be started with the alphabet.
- Dashboard Name should contain alphanumeric and underscore only.
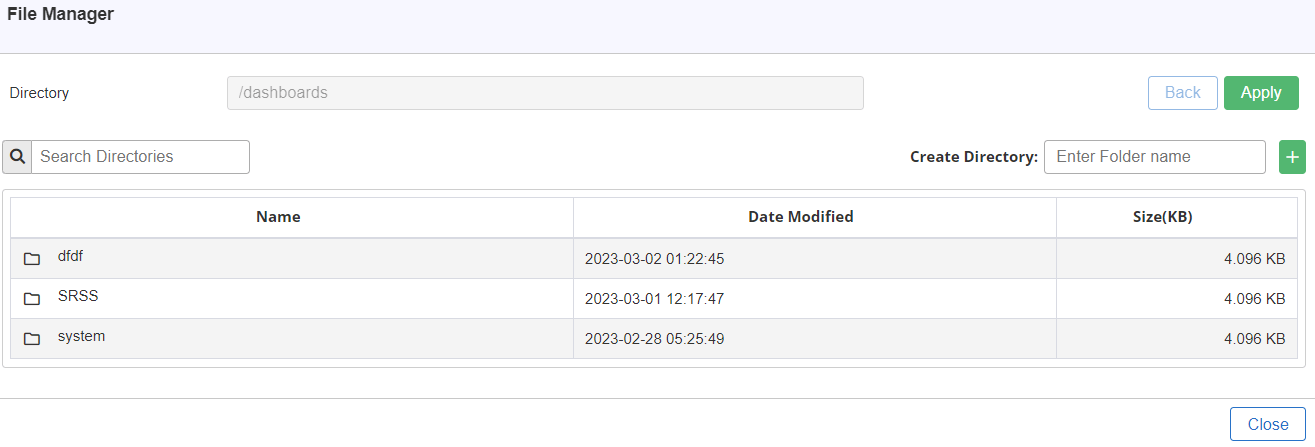
6. Click the Browse![]() button to browse the path where the new dashboard is to be saved. On clicking the browse button, the File Manager window will be displayed as shown in below figure.
button to browse the path where the new dashboard is to be saved. On clicking the browse button, the File Manager window will be displayed as shown in below figure.
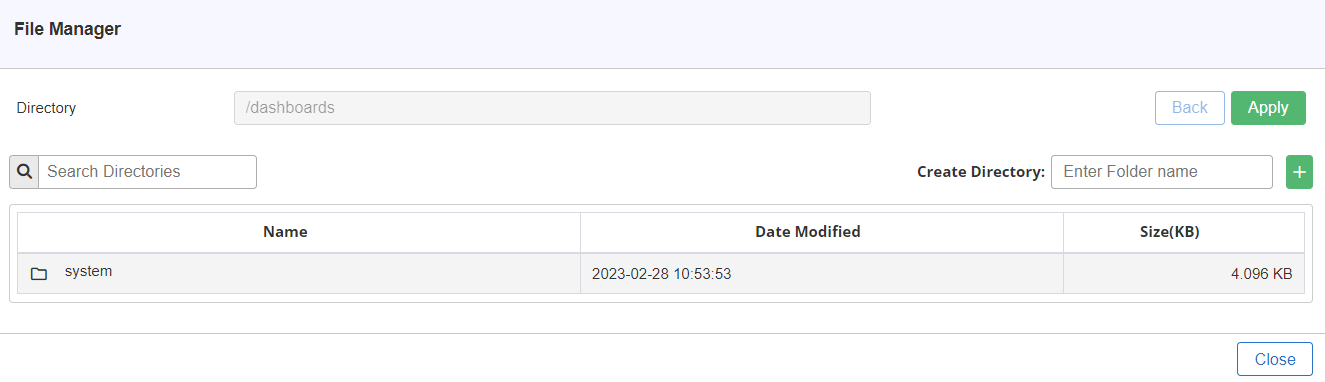
Note: Here, you can browse an existing directory or create a new one. You can also search for a directory. Once you browse the directory, click on Apply ![]() button.
button.
- Select the Shared permission from the available options:
- Read / Write: Other users can view and edit this favorite.
- Read Only: Other users can only view this favorite.
- Private Only: Other users cannot view/edit this favorite.
- User can also select the Save As option as Dashboard, if the user wants to save it as a dashboard.
- The new dashboard can be Save As in the following two options:
- Dashboard: This option will save the selected dashboard as a favorite.
- Dashboard Template: This option will save the selected dashboard as a replica of the favorite. Dashboard Template is use to change regular Dashboard to Dashboard Template which displays dynamic Dashboard. Group By “Subjects” and “Tag” panel comes on selecting Dashboard template option for dynamic Dashboard creation.
Notes:
- Click Save
 The favorite is saved in the list.
 - Click Create New Dashboard
 button, to create a new dashboard.
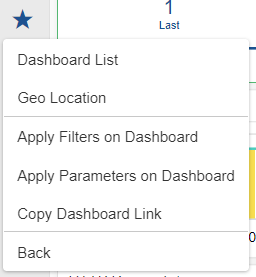
Favorite Operations
You can perform the following operations within this section:
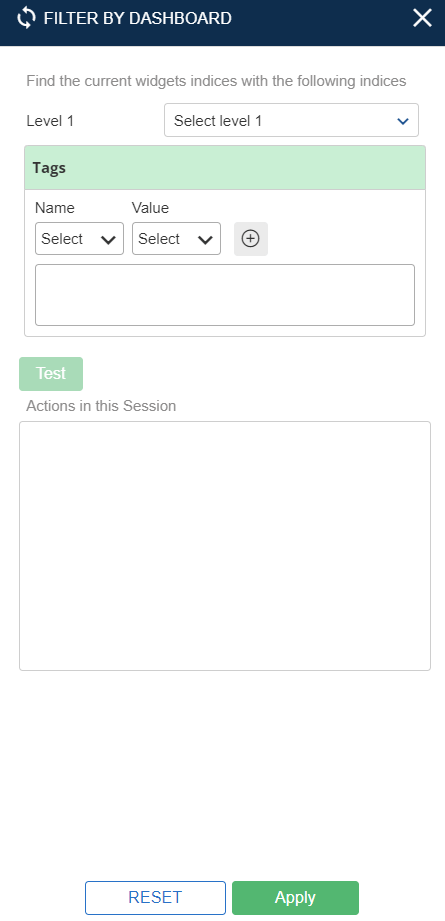
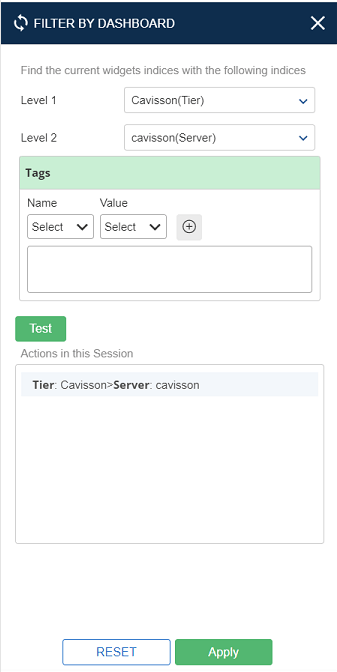
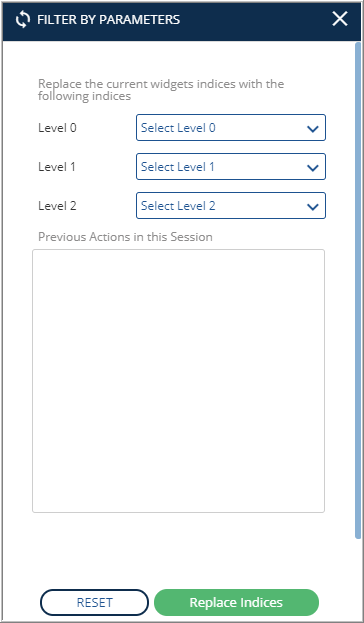
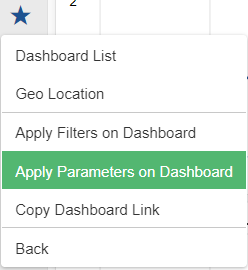
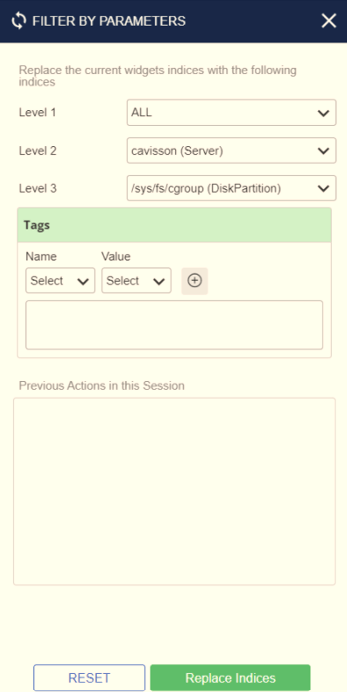
3. Specify the values for parameterization from Tier and Server Drop-Down and click on Replace Indices![]() button.
button.
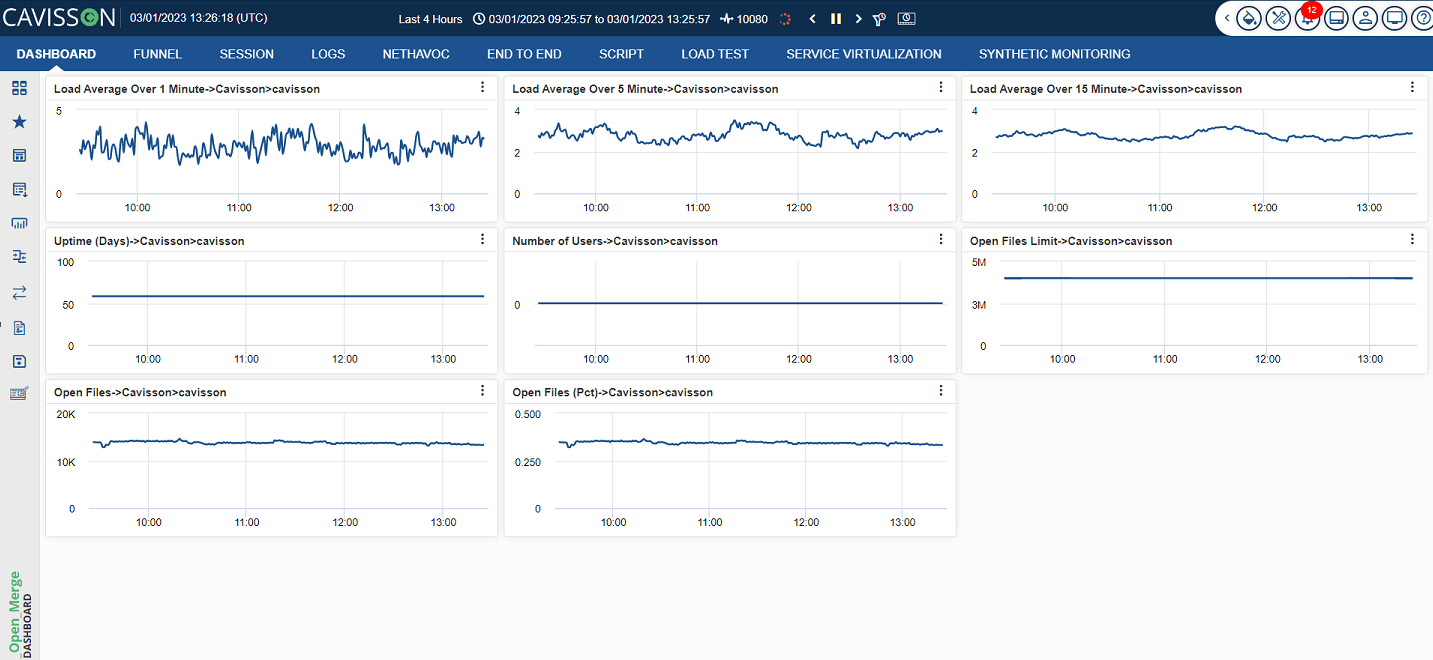
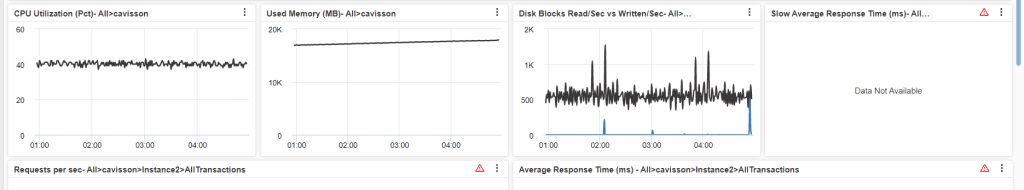
4. Parameterized graphs are displayed on the graph panel as shown in below figure.
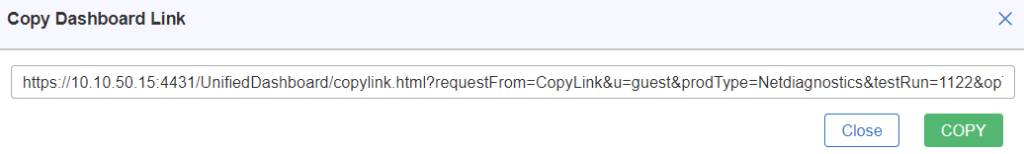
Note: To copy the dashboard link, click on the Copy ![]() button.
button.
- Click Refresh button
 , to refresh the list of favorites is and all the newly added favorites are displayed.
Manage Dashboard
On the left pane, go to Dashboard Favorite and click on the Dashboard List option then click on the Manage Dashboard ![]() icon. A list of Favorites is displayed as shown in below figure.
icon. A list of Favorites is displayed as shown in below figure.
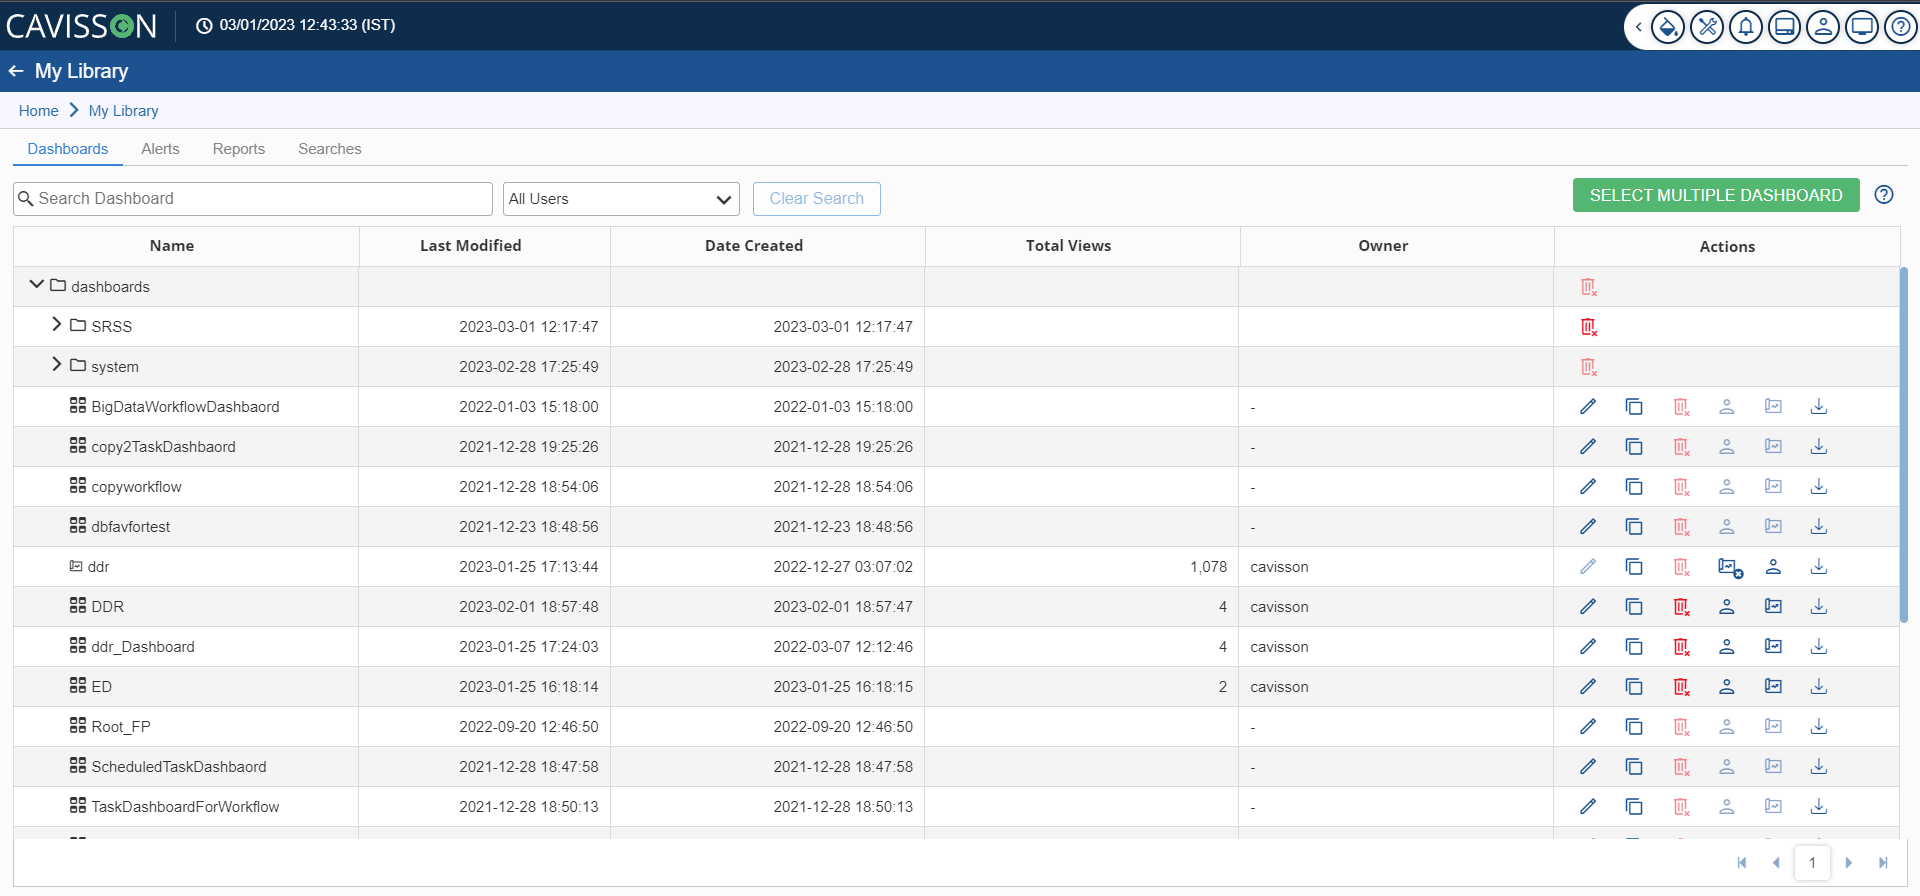
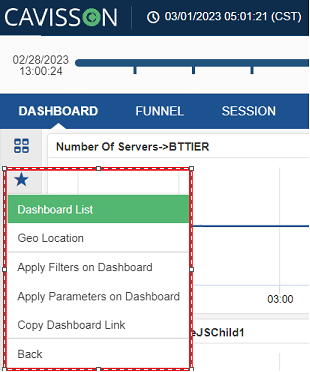
There are following options based on the user permission:
- Load: This option allows you to Load Selected Favorites graphs in the Favorite.
- Edit Dashboard: This option allows you to edit selected Favorites details, such as: favorite name, description and path.
- Copy Dashboard: This option allows you to copy selected Favorites to the required destination. You can copy the selected Favorites to the directories where Read/Write permissions are allowed.
- Export Dashboard: This option is used to download a selected favorite from the list.
- Delete Dashboard: This option allows you to delete selected Favorites from the list. You can delete multiple favorites even if the favorites lie in different directories.
- Make Self Default Dashboard: This option is used to save the favorite as Default for that particular user.
- Make Project Default Dashboard: This option is used to save the favorite as Project Default for all the users except those who have set any favorite as user default. An admin user can set this.
- System Default: This feature is only available for Admin capabilities and by this admin can make any favorite as system default. Dashboard searches if any favorite is marked as user default for current user. If not, then it searches for System default. If System default is also not defined, then it loads the _default favorite. If in any case _default favorite is also not there, then it loads the favorite which it keeps in memory.
- Actions: Option allows you to perform the following actions on the dashboards:
- Icon (
 ) allows you to edit selected dashboard details, such as dashboard name, description and path.
 - Icon allows you to copy the selected dashboard to the required destination. You can copy the selected dashboard to the directories where Read/Write Permissions are allowed.
- Icon allows you to delete selected dashboards from the list. You can delete multiple dashboards even if they are in different directories.
- Icon is used to save the dashboard as the project default for all user part of that project except those who have set any dashboard as the user default. An admin user can set this.
- used for making self-made dashboard.
Notes:
- You can search a dashboard based on the users.
- You can search a dashboard based on text string.
- You can select multiple dashboards at once and perform operations.
- You can delete multiple dashboards at once by selecting those and using the Delete at the top right corner.
Save Dashboard Changes
This feature is used to save the current changes in the dashboard. To apply this, follow the below mentioned steps:
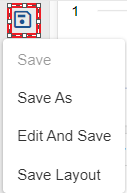
- Click the Save Option button on the left panel, there are the following options displayed:
- Save As
- Edit and Save
- Save Layout
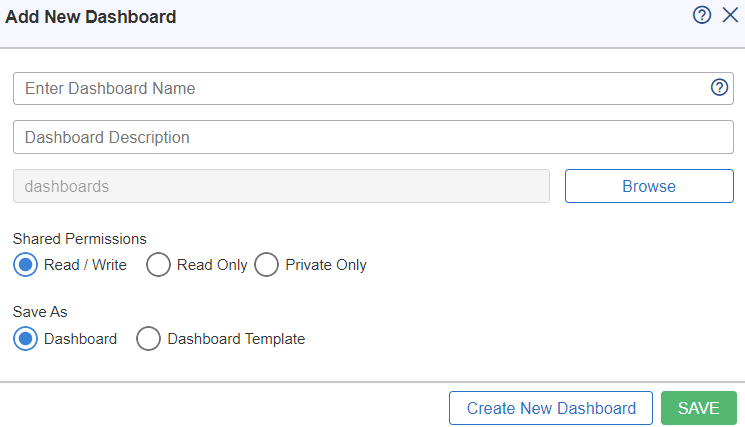
- By clicking on the Save As option, the system prompts for adding a new dashboard and save the changes as shown in below figure.
3. In the add new dashboard window, enter the dashboard name and description for the new dashboard, select the required shared permission option such as: Read/Write, Read Only, and Private Only.
Note: You can also provide the path on which the new dashboard is to be added. To select the path, click on the Browse ![]() button.
button.
4. On clicking the browse button, the File Manager window will appear as shown in below figure
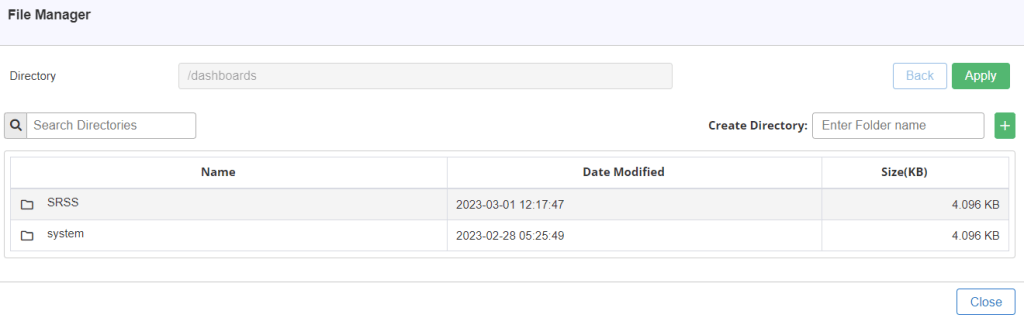

- You can click on the Back
 button to go back to the File Manager
 - You can click on the Apply
 button, to use the selected directory for the new dashboard.
On clicking the Apply button, the selected directory with its path will be displayed on the Add New Dashboard window as shown in below figure.
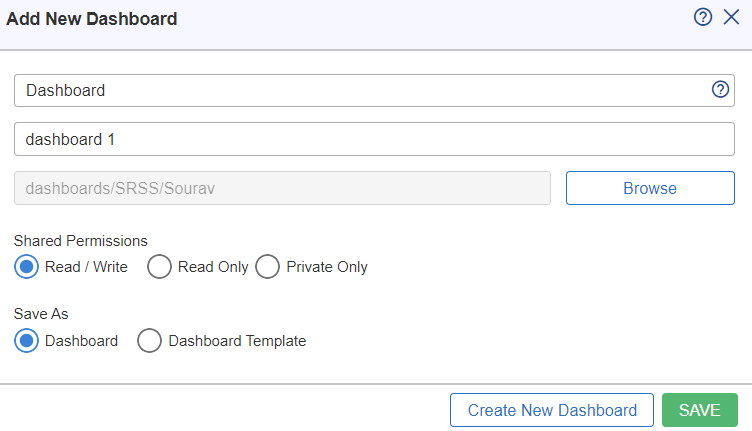
Select the Save ![]() option to save the dashboard as shown in below figure.
option to save the dashboard as shown in below figure.

In the add new dashboard window, enter the dashboard name and description for the new dashboard, select the required shared permission option such as: Read/Write, Read Only and Private Only.
Note: You can also provide the path on which the new dashboard is to be added. To select the path, click on the Browse ![]() button.
button.
On clicking the browse button, the File Manager window will appear as shown in below figure.